
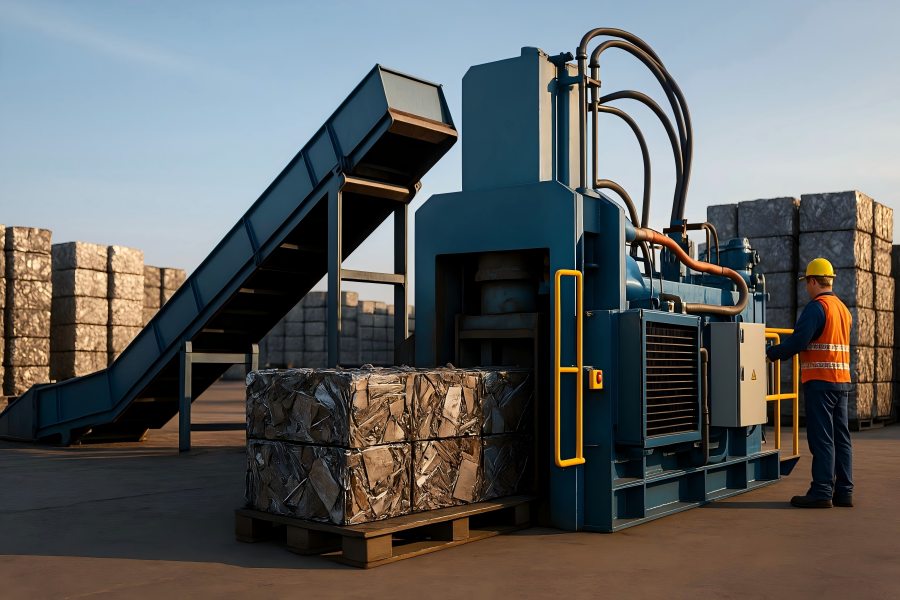
Scrap yards run on throughput, bale quality, and uptime. When an aging metal baler starts eating hours and spitting out inconsistent bales, the real cost shows up in overtime, freight, and lost margin.
Here are five concrete signals you can use to decide if it’s time to replace rather than repair.
Executive snapshot: the 5 signs
- Throughput and cycle times are slipping versus nameplate, and variance keeps widening.
- Maintenance spend is climbing while parts become scarce or delayed.
- Bale density and quality are inconsistent, driving rejections or freight penalties.
- Safety and compliance drifts are creeping in (guards, hydraulics, controls).
- Energy per ton and hydraulic efficiency are worsening year over year.
Sign 1 — Throughput slump and cycle-time variability
What you’ll see: Bales per hour drifting down 10–30% from historical figures. Operators complain about more “waits” in the stroke. You notice longer warm-up needs and stalls under heavy feed.
KPI to track
- Bales/hour by material family (e.g., light steel stampings, heavy melt, aluminum extrusions).
- Average cycle time and coefficient of variation (CV) across a shift. A CV above ~12–15% indicates intermittent hydraulic or control issues.
- Bale mass (t/bale): low or volatile mass undermines load planning.
Why it matters: Throughput isn’t just volume; it governs your ability to consolidate freight efficiently and keep inbound/outbound flows smooth. Cycle-time variance magnifies staffing and logistics inefficiency because you can’t forecast.
Quick test: Run 50 cycles on a standard grade you process often; timestamp each cycle end (a simple smartphone stopwatch + spreadsheet works). If your current mean cycle time exceeds historical by >15%, or the CV is >15%, deterioration is statistically significant, not a one-off.
Sign 2 — Rising maintenance spend and parts obsolescence
What you’ll see: Monthly MRO spend inching up 10–20% each year; scavenging used parts; OEM lead times stretching from days to weeks; more weekend callouts.
KPI to track
- Maintenance cost as % of replacement value (RAV): When annual maintenance tops 6–8% of RAV on older metal balers, you’re likely beyond economic repair.
- Mean time between failures (MTBF): Any downward trend across the last 12 months is a red flag.
- Lead time for critical spares: >10 business days for pumps, valves, PLC cards, or cylinders equals a higher downtime risk.
Why it matters: Planned maintenance is cheap; unplanned is brutal. Once spares become custom-fabricated or used-market only, your mean downtime per incident jumps.
Quick test: Pull 24 months of spend and categorize by planned vs. unplanned. If unplanned >40% of total, reliability is already eroding profit.
Sign 3 — Bale density and quality drift
What you’ll see: Buyers push back: “Bales too springy,” “contamination too high,” or “density not in range.” You also see more strap failures and corner blowouts.
KPI to track
- Bale density (t/m³) against buyer targets for each grade. (Targets vary by mill/buyer; treat the buyer spec as your truth.)
- Density variation within a lot (max–min/mean). A variation of>10–12% signals hydraulic or die wear issues.
- Out-of-spec rate (% of bales needing rework or discount).
Why it matters: Density directly influences freight (more tons per trailer when volumetric-limited), mill acceptance, and furnace charge efficiency. Quality drift costs you twice—once in freight, again at the scale or in downgraded pay.
Quick test: For your top two grades, measure L×W×H and weight for 10 consecutive bales. Plot density. If your mean is inside spec but >12% scatter exists, mechanical or control consistency has degraded.
Sign 4 — Safety and compliance drift
What you’ll see: Temporary fixes on guards; manual overrides creeping into daily practice; hydraulic misting or persistent leaks; older controls without modern interlocks.
KPI to track
- Near-miss and recordable incident rates at the baler station.
- Guarding integrity score (simple audit checklist each month).
- Hydraulic leak-rate trend (oil added per month).
- Lockout/Tagout (LOTO) adherence audits.
Why it matters: Beyond human stakes, insurance and regulatory exposure climb fast as equipment ages. Newer machines ship with safer guarding, light curtains, redundant interlocks, and better diagnostics that reduce human workarounds.
Quick test: Do a 30-minute safety audit with a supervisor and operator. If you log more than three corrective actions that require parts or fabrication, add them to the “true cost” of keeping the unit.
Sign 5 — Energy and hydraulic inefficiency
What you’ll see: Utility bills creeping up even when tonnage is flat. The power draw spikes harder on compaction strokes. Oil runs hotter; cooling struggles on warm days.
KPI to track
- kWh per ton (energy intensity) by grade.
- Hydraulic efficiency indicators: oil temperature profile under load,pressure vs. flow curves, pump/motor power factor.
- Idle energy usage: kWh consumed while not baling but “ready.”
Why it matters: Modern servo-hydraulic packages and smarter control logic can cut energy intensity by double-digits. That’s especially valuable as electricity rates rise and ESG reporting grows stricter.
Quick test: Pull a week of meter data or install a clamp meter/logger for one shift. If kWh/ton has risen >15% vs. last year while density hasn’t, you’re paying an “age tax.”
The decision table: what to measure and when to act
Use this table with your ops lead to turn symptoms into a go/no-go replacement call. Thresholds below are practical triggers—adapt them to your buyer specs and local costs.
| Sign | KPI to Watch | Practical Trigger | How to Measure | Likely Cost Impact |
| Throughput slump | Bales/hr; cycle time CV | >15% drop vs. 12-mo avg or CV >15% | Time 50 cycles; compare to logbook | Overtime, missed loads, lower daily tons |
| Maintenance creep | Maintenance % of RAV | >6–8%/yr, with unplanned >40% | 24-mo spend analysis | Escalating downtime + weekend callouts |
| Bale quality drift | Density (t/m³) and scatter | >10–12% lot scatter or buyer rework >3% | Measure 10 bales/lot | Freight inefficiency; price downgrades |
| Safety drift | Near misses; guarding score | >2 near-misses/quarter; >3 guard issues | Monthly audit + incident log | Insurance, regulatory risk, morale |
| Energy inefficiency | kWh/ton; idle draw | >15% rise YoY at flat density | Metered shift; utility data | Utility costs, heat stress on hydraulics |
Real numbers: an illustrative ROI and payback model
Every yard is different, so don’t treat these figures as universal. The point is to show how the math can favor replacement before the old unit truly dies.
Current baler snapshot (illustrative)
- Effective production window: 6 hours/day, 22 days/month
- Throughput: ~5.0 t/h (12 bales/h × 0.42 t/bale)
- Tonnage/month: ~660 t
- Energy intensity: 60 kWh/t
- Maintenance: $6,000/month (40% unplanned)
- Downtime: 20 h/month; opportunity cost $1,200/h (missed processing, rescheduling)
- Outbound shipments: ~100/month; average transport cost $450/trip
- Bale density: 0.42 t/bale (volumetric limit is often the bottleneck on loads)
New baler proposal (illustrative)
- Throughput capability: ~8.0 t/h (18 bales/h × 0.45 t/bale) on same material
- Energy intensity: 42 kWh/t (modern servo-hydraulic)
- Maintenance: $2,500/month planned; unplanned minimal in year 1–2
- Downtime: 6 h/month expected (commissioned, under warranty)
- Bale density uplift: +7–10% on light grades via tighter compaction control
- Capex (delivered & installed): $450,000; useful life 10+ yrs
Monthly savings (processing same 660 t to isolate opex)
- Energy: (60 − 42) × 660 = 11,880 kWh saved → at $0.12/kWh = $1,425/month
- Maintenance: $6,000 − $2,500 = $3,500/month
- Downtime avoided: (20 − 6) × $1,200 = $16,800/month
- Freight efficiency (from density + load consistency): If density improvement trims ~9% of trips (e.g., 100 → 91 trips), trips avoided = 9 → 9 × $450 ≈ $4,050/month
- Total direct monthly opex improvement: $1,425 + $3,500 + $16,800 + $4,050 = $25,775
Optional upside: capture more tons
If inbound supply allows, you can process more in the same staffed window:
- New baler at 8.0 t/h × 6 h/day × 22 days = ~1,056 t/month
- Incremental capacity = ~396 t/month
Even if you choose not to chase volume, extra headroom cushions peak weeks and reduces overtime.
Simple payback and ROI (cash purchase)
- Capex: $450,000
- Annualized savings (same-tonnage case): ~$25,775 × 12 = $309,300
- Simple payback: $450,000 / $309,300 ≈ 1.46 years (~17–18 months)
- Year-1 ROI: $309,300 / $450,000 ≈ 69%
If you finance at roughly $8,500/month over five years, your net after debt service is still strongly positive in this illustration.
Process capability: proving it with data before you buy
Baseline your current machine (2 weeks)
Log cycle times, density, kWh/ton, and unplanned downtime. Pull 24 months of maintenance invoices and parts lead times. Have operators note any overrides or workarounds.
Run controlled trials
Select two representative grades. Produce 30–50 bales each, weigh and measure them, and record cycle times. This gives a statistically meaningful baseline to compare with demos.
Demand a like-for-like demo (or factory test)
Ask vendors to process the same grades (or close analogs) at target bale dimensions. Request raw data: cycle times, amps/pressure traces, actual bale weights, and oil temps.
Verify buyer acceptance
Share a small demo lot with your buyer if possible (or at least the measurements) to confirm density/size preferences and stacking compatibility.
Model your opex and freight with your numbers
Swap your local electric rate, transport costs, and wages into the ROI model. Replicate the decision table with your data.
Example decision model (fill with your yard’s numbers)
| Metric | Current Baler | Candidate Baler | Delta | Notes |
| Throughput (t/h) | 5.0 | 8.0 | +3.0 | Same mix/shift staffing |
| Effective hours/month | 132 | 132 | — | 6 h/day × 22 days |
| Tons/month | 660 | 660 (headroom to 1,056) | — | Hold tons constant to isolate opex |
| Energy intensity (kWh/t) | 60 | 42 | −18 | Metered or vendor spec + demo |
| Monthly energy (kWh) | 39,600 | 27,720 | −11,880 | Equals $1,425 at $0.12/kWh |
| Maintenance ($/mo) | 6,000 | 2,500 | −3,500 | Include labor + parts |
| Unplanned downtime (h/mo) | 20 | 6 | −14 | Value at $1,200/h |
| Downtime cost ($/mo) | 24,000 | 7,200 | −16,800 | Opportunity cost basis |
| Trips/month | 100 | 91 | −9 | From density & consistency |
| Freight cost ($/mo) | 45,000 | 40,950 | −4,050 | At $450/trip |
| Total opex delta ($/mo) | — | — | −25,775 | Savings favor replacement |
| Capex ($) | — | 450,000 | — | Delivered & installed |
| Simple payback (mo) | — | — | ≈17–18 | 450,000 / 25,775 |
Choosing the right replacement
Match baler type to your job mix
- Three-compression stationary baler (top/side/main): Great density and consistent bale geometry for scrap grades that are primarily volumetric-limited in shipping.
- Shear/baler/logger (SBL): Versatility for yards with more mixed streams and need to size-reduce long pieces; less ideal if you need extremely uniform bale geometry for mill contracts.
- Briquetter: High density for turnings and chips, with coolant recovery—complements, not replaces, a general baler.
- Two-ram systems: Strong for high-volume operations that prize cycle speed and automation; confirm bale tie method and strap costs.
Capacity isn’t everything
- Hydraulic horsepower vs. duty cycle: Continuous vs. intermittent compaction duty affects motor sizing and cooling requirements.
- Controls and diagnostics: Modern PLCs with pressure-velocity profiles and self-diagnostics slash troubleshooting time and prevent over-compaction that shortens machine life.
- Wear surfaces and liners: Inspect alloy liner materials and replacement procedures; quick-change designs cut maintenance hours.
- Bale handling integration: Outfeed conveyors, bale ejectors, and stacking compatibility matter as much as.
Installation realities
- Power and harmonics: Confirm available service (e.g., 480V 3-phase) and VFD harmonics mitigation if required by your utility.
- Oil and heat management: Right-sized raw cycle speed. Coolers keep fluids in spec on hot days; oversized cooling extends seal life.
- Foundation and anchoring: Verify slab thickness and reinforcement; dynamic loads vary by machine.
- Operator training: The best gains vanish without standard work—get vendor training included and insist on SOPs with setpoints for each grade.


